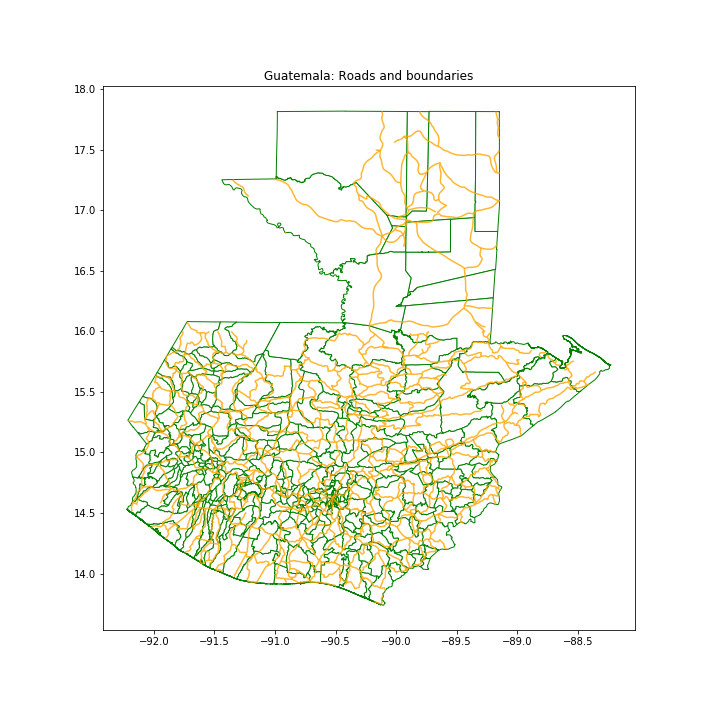
I recently began using GeoPandas for mapping geographic data (shapefiles, geojson, etc.) These are the results of a couple exploratory exercises.
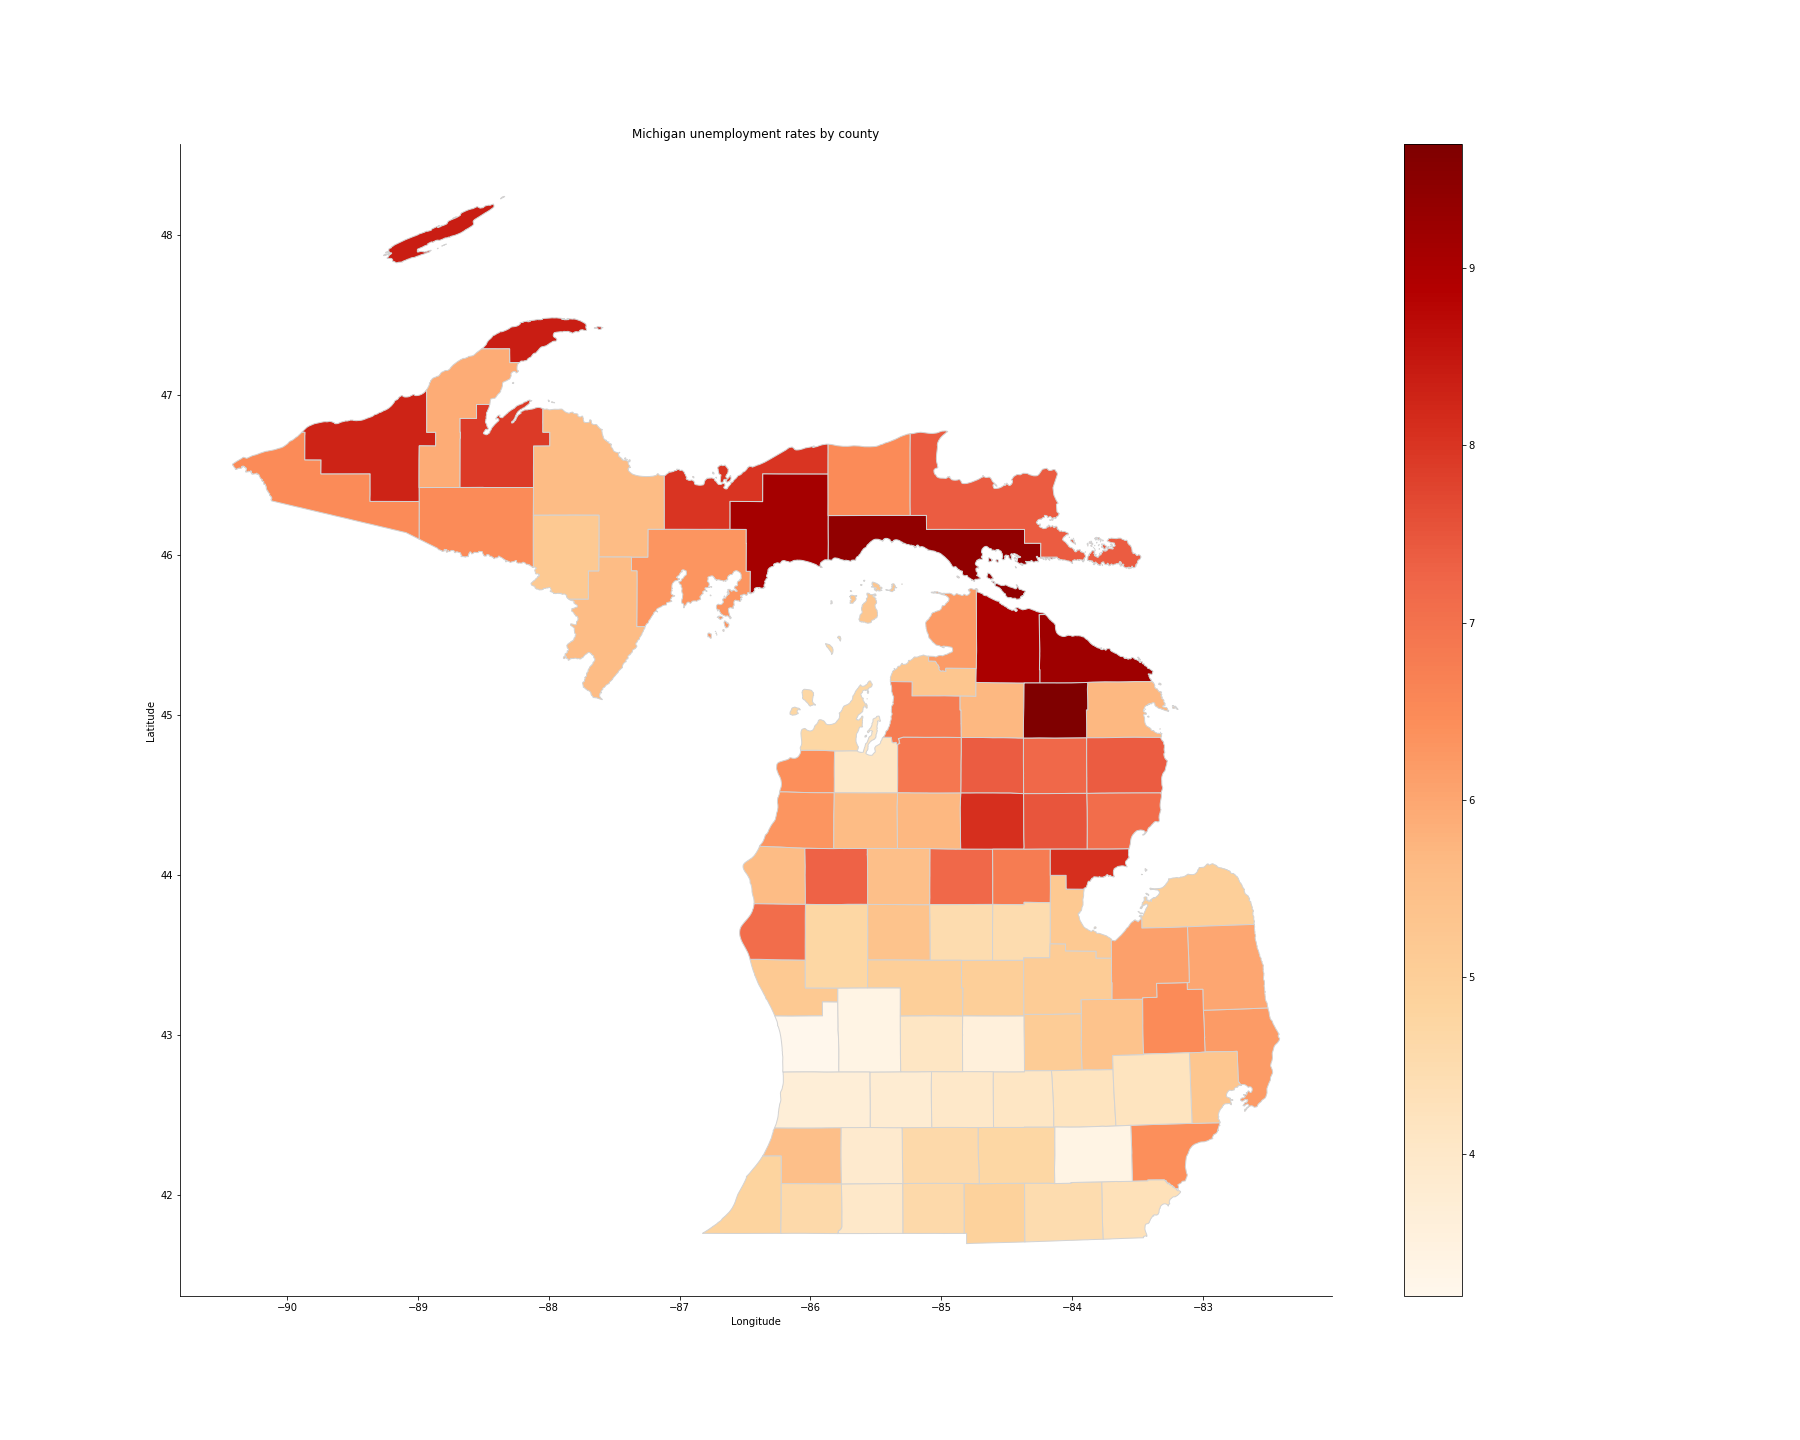
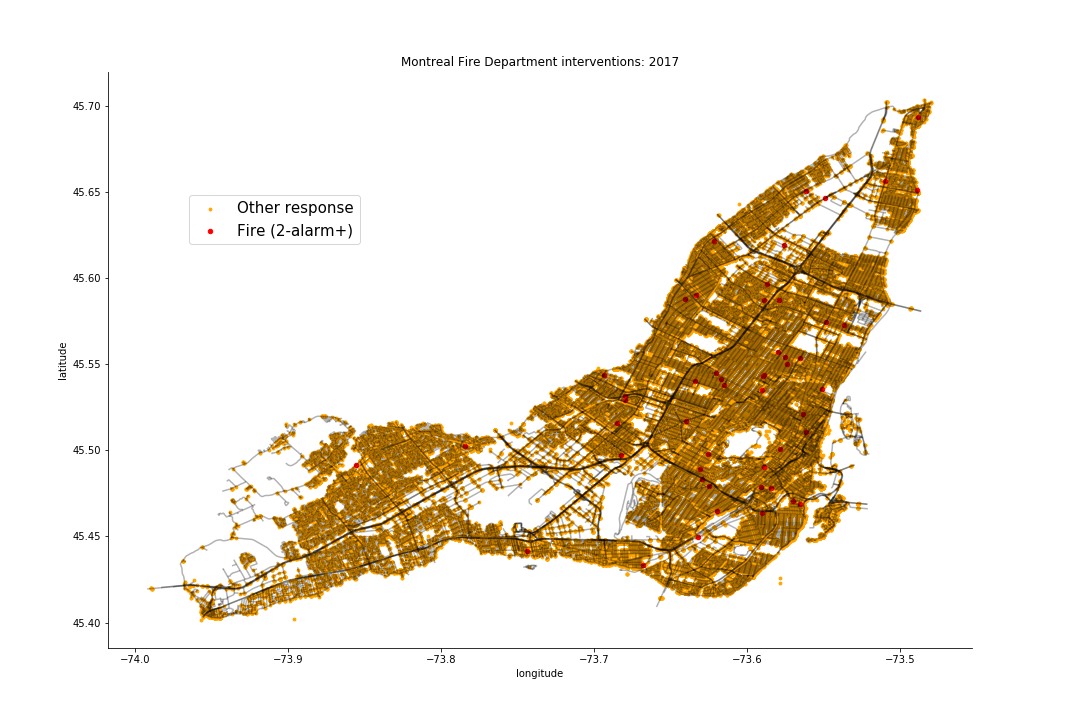
A map of Guatemala's roads, layered over the administrative state and municipality borders. Both roads data and administrative border data are shapefiles from DIVA-GIS.org.A choropleth map of unemployment rates across Michigan.In this map, a base shapefile layer of Montreal's roadways is populated with the Montreal Fire Department's 2018 response data. Notably, the incident locations (latitude and longitude, in CSV format) did not need to be converted to GIS points in order to be plotted. With the coordinate reference system (CRS) of the shapefile set to latitude/longitude, it is possible to plot CSV and shapefile data to a single figure.