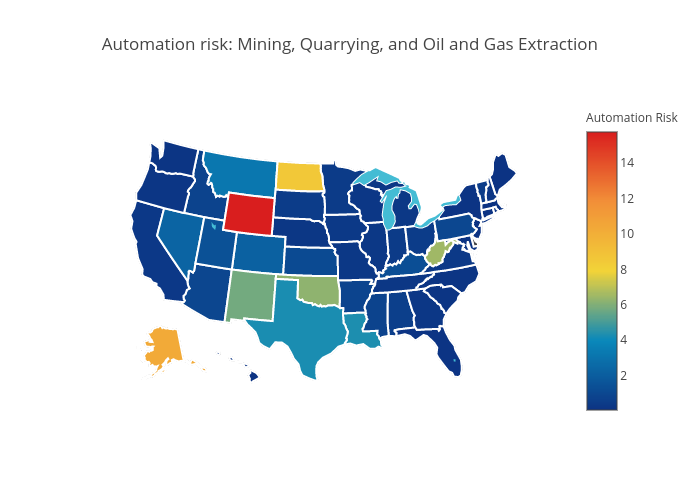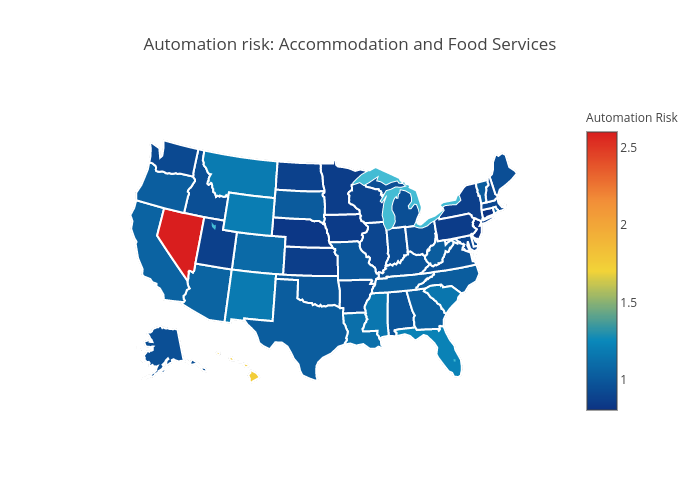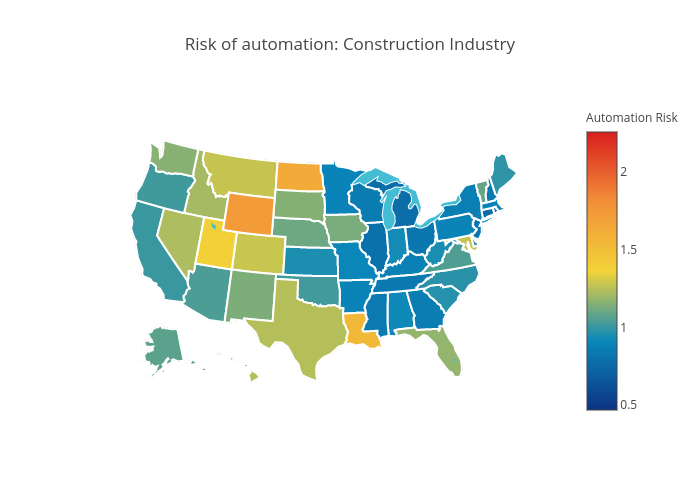
Created with Python and the Plotly library, these figures illustrate the risk of automation to various U.S. industries across states. These location quotients were calculated using automation probabilities from the McKinsey Global Institute and occupational data from the U.S. Bureau of Labor Statistics. A value of one means a risk equal with that of the national average, a value of two, twice the national average, etc.
Individual state data can be viewed by hovering over the map.
Construction is one of many industries we analyzed:
Mining and extractive industries are particularly at risk in certain states.